By Risa Sackman, Felix Fernandez and Liza Rodler
As schools across the U.S. struggle to recover learning loss due to COVID-19, one school we work with is using a data-driven approach that is helping students make up lost ground.
For the past seven years, we have partnered with the GHR Foundation to help a network of high-needs K-8 Catholic schools in the Minneapolis-Saint Paul area strengthen their capacity to track, store, and use math and reading assessment data to inform instruction and assess gaps. These schools face many of the same pandemic-related learning challenges as public schools have.
Recently, we have focused on analyzing annual assessment data to help measure COVID-19 learning loss. We maintain online data dashboards and provide annual reports for each school to summarize data on overall student proficiency and growth. We look for signs of learning recovery across student groups by disaggregating data by subject/content area, grade level, gender, race/ethnicity, and socioeconomic status, and by examining trends before and after the pandemic started.
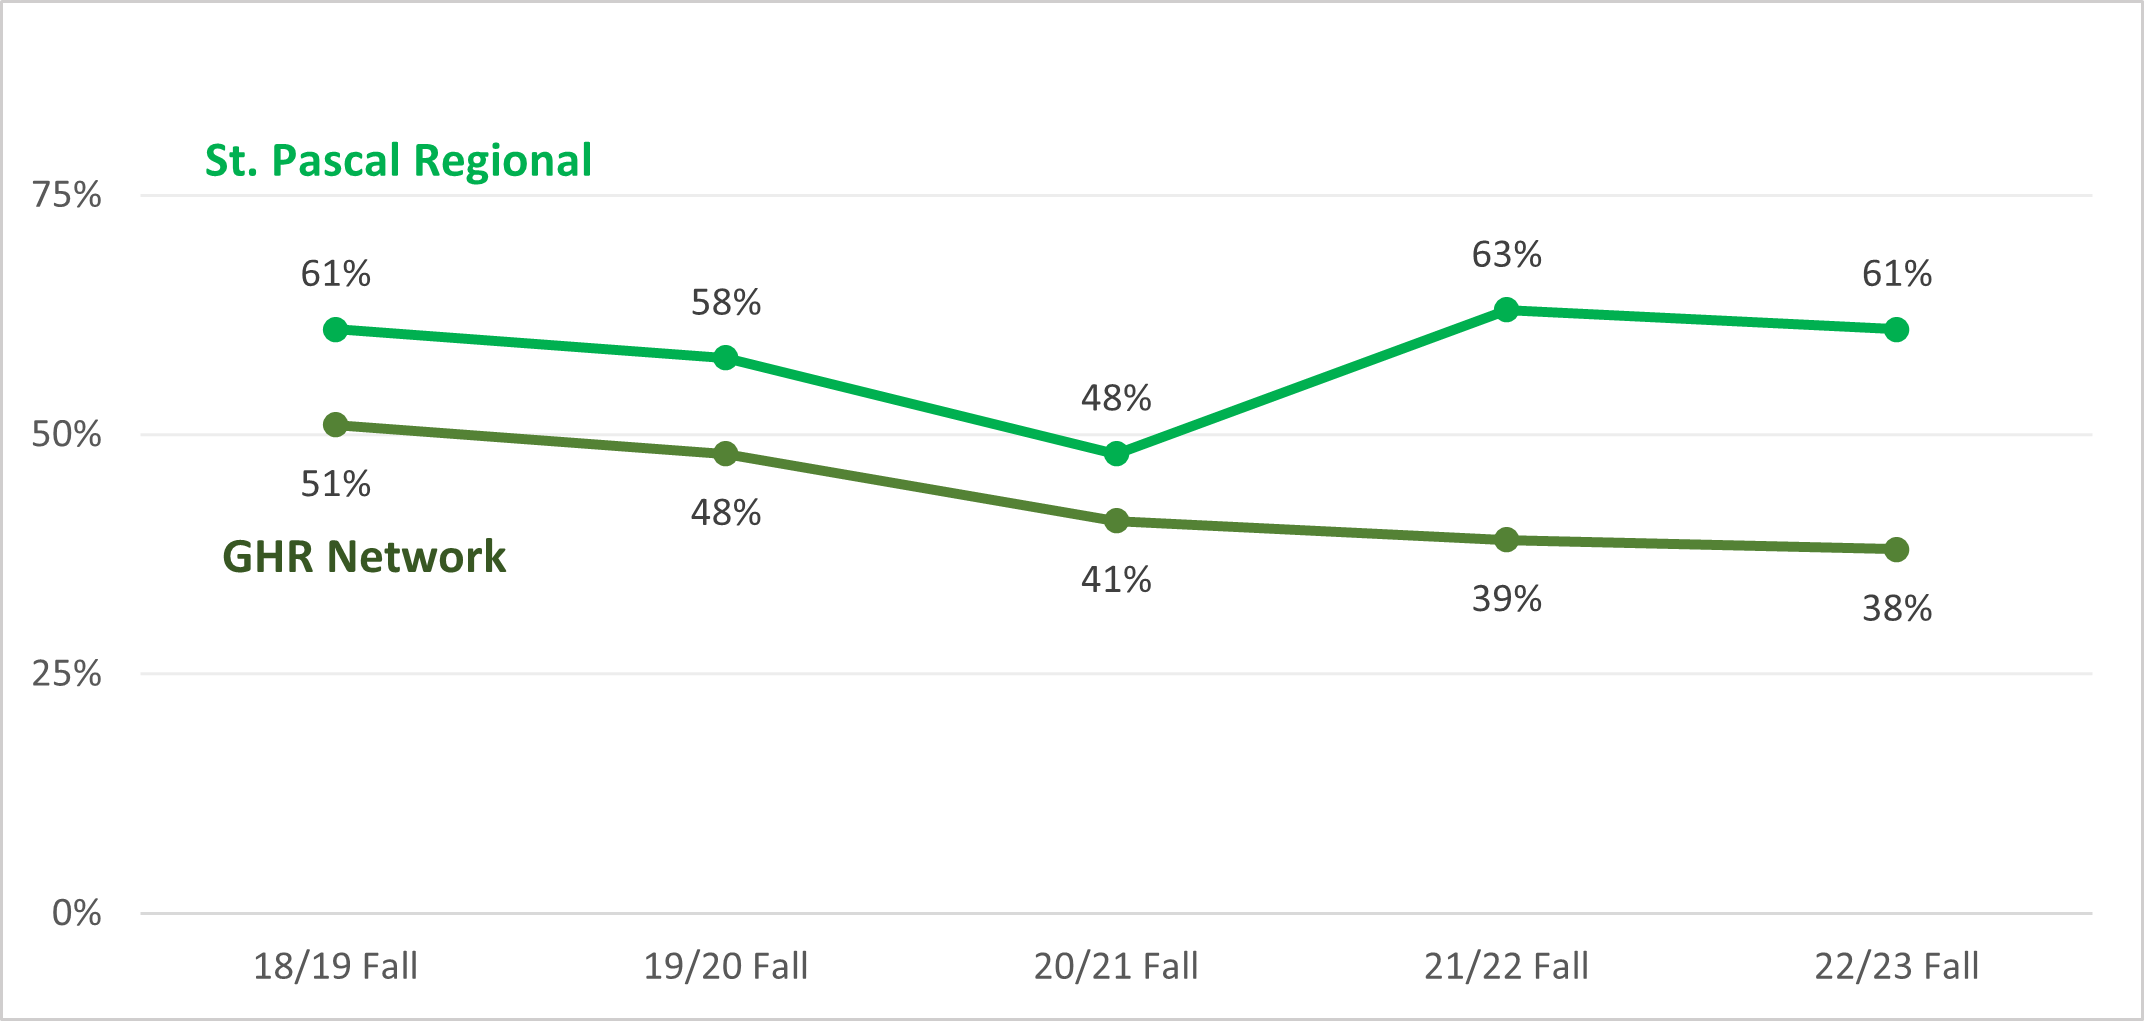
We found that math proficiency at the network schools overall continued to decline since the pandemic began. However, at one school, St. Pascal Regional Catholic School, students demonstrated a remarkable recovery in math. While math scores at the school fell 12 percentage points between fall 2019 and fall 2020 – in line with the trends in math scores at other network schools – scores rose 15 percentage points in fall 2021, returning to pre-pandemic levels.
St. Pascal Regional’s principal, Inna Collier Paske, cites the school’s implementation of individualized learning plans (ILPs) for the improvement. Having started implementing ILPs the year prior to the pandemic, St Pascal Regional is unique amongst their peers in both implementation and intensity of their ILPs. For the past four years they have continually reviewed and revised their approach to reflect their needs and priorities, expanded ILPs to include additional subjects, and incorporated social emotional learning goals alongside academic ones. At strategic points throughout each year ILPs provide a snapshot of each student’s gaps and strengths that teachers can use to plan instruction and support that will help their students thrive.
We visited the school in 2023 to learn more about its approach. We conducted nine interviews with school administrators (2), teachers (4), and caregivers (3); observed the kindergarten, second, and fourth grade classrooms during math and literacy instruction; and participated in a guided tour of the school. Interviews were recorded and transcribed, and we reviewed transcripts and observational notes to identify generalizable themes from our visit. Collier Paske and GHR reviewed these themes for validation.
St. Pascal Regional Math Proficiency by Fall Term Compared to Overall Network of Schools
We learned that the school’s ILPs — codesigned by its administrators and teachers — include longitudinal assessment data to provide a picture of students’ progress over time, along with individual and class goals in math, reading, and social-emotional learning. At the beginning of the school year, an administrator provides the reading and math data for each student’s ILP. Teachers then add their own data, observations, and information they learned from each student’s family, along with student and class goals and strategies for reaching them.
Teachers update the ILPs in the winter and spring, as additional periodic assessment data become available. One teacher told us that an ILP is “a plan that’s made for each child — where do they need the most help? … Not where’s the whole class at, but where does that kid need the most help? And how am I going to do it?”
While St. Pascal Regional’s approach works for its small size (approximately 110 students) and specific population (racially diverse, economically disadvantaged), we observed five lessons other schools can consider for their own learning recovery efforts:
Lesson 1: Start with the data
The Northwestern Evaluation Association Measures of Academic Progress (NWEA MAP) assessments are the bedrock of every ILP at the school. NWEA MAP assessments are norm-referenced achievement tests in math and reading that measure students’ performance and growth over time. Based on our years of partnership with the school and GHR, we know firsthand the importance of consistent, accurate, and readily accessible data collection to monitor student proficiency and growth.
Updating the ILPs with this information throughout the year gives teachers a structured way to review students’ assessment data from previous terms to understand their strengths and areas for improvement. NWEA MAP provides written summaries of assessment results, suggested areas of focus, and data visualizations of how each student’s progress compares to other students. Teachers use this information to create manageable goals for each student and the whole class. “You’re not a good or bad teacher because of your data,” Collier Paske, the principal, commented during our visit. “You’re a good teacher if you can create data-driven instruction based on your data.”
Lesson 2: Allow time for periodic review, support, and development
Developing ILPs takes a significant amount of time and skill, so it is critical for administrators to provide teachers with professional development, direct support, and allocated time. Teachers told us that it takes 30 to 90 minutes to create each student’s ILP, plus additional time to update them throughout the year. This makes it nearly impossible to fit ILPs into teachers’ designated prep periods. Collier Paske schedules specific professional development days for ILP writing and has the school’s floating substitute cover teachers’ classes so they can write ILPs during school days.
Teachers said these supports are helpful even in small doses, such as having a sub cover a classroom for 2 hours. Collier Paske also reviews every student’s ILP, evaluates their assessment data in a master spreadsheet, and gives teachers feedback so they can improve their ILPs over time. Reviewing ILPs also helps her stay abreast of students’ needs and effective teacher strategies, which she shares with other teachers. She and the teachers also reflect on the ILP process at the end of the year to find ways to improve it.
Lesson 3: Identify both class and individual student goals
ILPs give teachers a framework to both individualize supports for every student and identify trends in their class overall. NWEA suggests individual goals for each student and whole class goals, which are competencies or subject areas that a significant number of students need to work on. To help students reach these goals, teachers design interventions and activities that help develop target skills. Interventions may not work equally well for all students, so teachers are encouraged to individualize supports as much as possible.
However, ILPs also help teachers recognize trends and identify interventions that may work for many students. During our visit, we observed teachers grouping students with similar needs together during math and literacy instruction to complete activities that support their specific ILP goals. Teachers celebrated individual successes and encouraged students to cheer for themselves and others as they completed tasks. In this way, ILPs help teachers encourage collaboration among students with similar goals and interventions.
Lesson 4: Share information and resources
ILPs are kept in a shared drive so teachers can access students’ ILPs from previous years. This lets teachers review their students’ progress over time as well as learn how other teachers approach their ILPs.
“There’s not one perfect way to do it,” one teacher said during our visit. “I definitely went into other people’s [ILPs] and looked at how they were doing it and used what I thought would fit for me.” Teachers also collaborate more informally by sharing ideas and resources. For example, one teacher created a curriculum calendar based on her students’ ILPs that covers different focus skills each month and helps ensure that she creates activities for all planned topics.
Lesson 5: Establish social-emotional learning goals
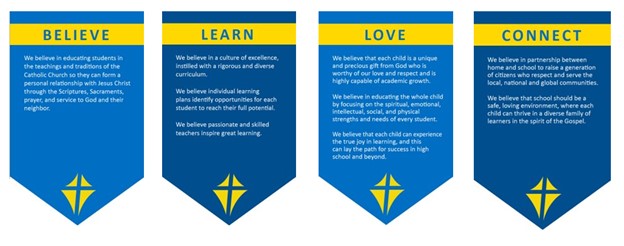
For each student’s ILP, teachers create social-emotional learning (SEL) goals that reflect the “four pillars” — believe, learn, love, connect — St. Pascal Regional embeds in all learning experiences. To create these goals, teachers identify how students learn best and use information students’ families shared. Input from families can be especially helpful in creating fall SEL goals, as teachers haven’t yet had much time to observe students’ SEL needs. The school also provides professional development and CASEL resources to support teachers in helping students reach SEL goals. During our visit, caregivers shared how important the pillars are.
“I like that [teachers] combine, for example, the love,” one caregiver said. “I see the teachers here when they have a problem with the kids, they talk a lot with them and try to explain to them. I like that they have passion because you need a lot of passion with kids.”
St. Pascal Regional’s Four Pillars
An adaptable data-driven approach
St. Pascal Regional’s ILP approach is an effective learning acceleration strategy that identifies learning gaps and creates supports to help ensure every student is working on grade level. Other schools might need to adapt this approach for their specific contexts. But we believe the lessons from St. Pascal Regional’s experience can be important levers for any data-driven practice at the school level. With these strategies, educators can better use data to ensure all students have what they need to thrive.
Photo By: Tamika Garscia